Power Query vs SQL vs pandas for Data Cleaning
How Power Query, SQL and pandas compare for data cleaning: where each runs, who it suits, how each treats missing values and duplicates, and how to choose.
By Tnas · Published · 8 min read
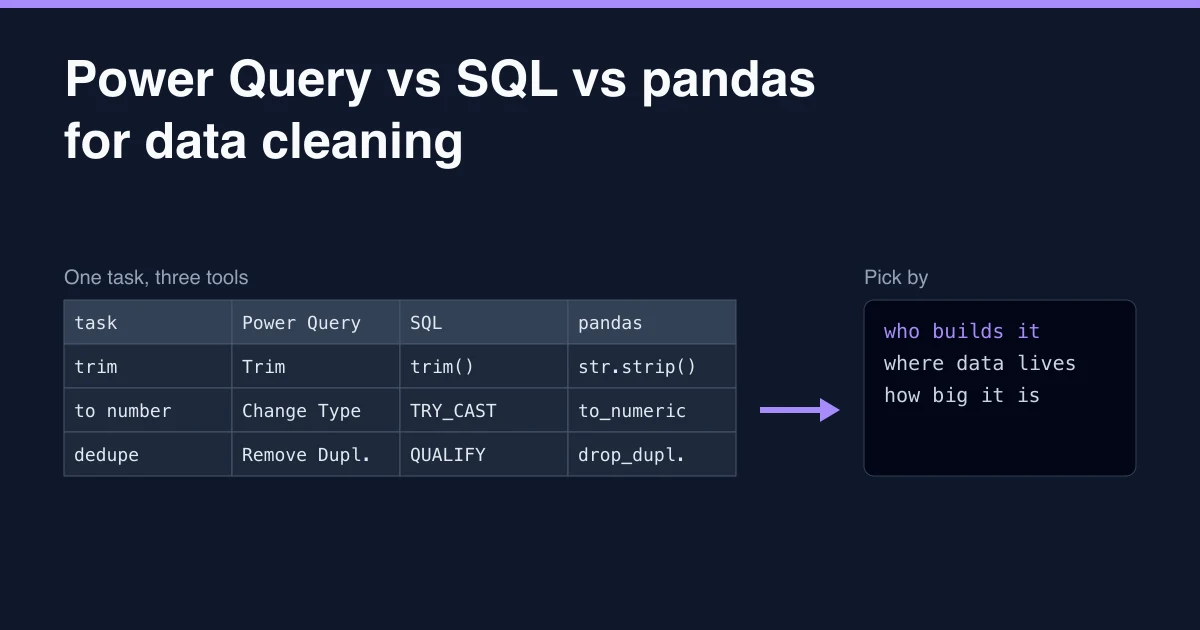
All three tools can do everyday data cleaning: trimming text, converting types, mapping categories, removing duplicates, joining lookups and reshaping. The choice comes down to three questions. Who builds and maintains the cleaning? Where does the data live? How big is it, and what happens to it next?
In short: Power Query suits Excel and Power BI users preparing recurring files without code. SQL suits data that lives in tables or databases, rules that should be set-based and reviewable, and data too large for a desktop tool. pandas suits work that already lives in Python, needs complex row-level logic, or feeds analysis, testing or machine learning in the same script.
Key Takeaways
- Power Query is the low-code option for recurring file preparation: it records cleaning as refreshable steps inside Excel and Power BI.
- SQL (for example DuckDB) expresses cleaning as set-based queries that run where the data is and are easy to review as text.
- pandas gives full Python control and the testing ecosystem, but its defaults (type inference, dropping missing keys in group-by) need overriding.
- The tools disagree on details that change results: missing values in comparisons and sums, and which row a deduplication keeps.
- Many teams use more than one: Power Query for a business-owned report, SQL for the shared pipeline, pandas for analysis.
Power Query, SQL and pandas at a glance
| Power Query | SQL (DuckDB) | pandas | |
|---|---|---|---|
| How you work | Menus and applied steps; M code underneath | Text queries | Python code |
| Where it runs | Excel, Power BI, Microsoft Fabric and other Microsoft hosts | Inside a database engine or in-process (DuckDB) | In a Python process |
| Typical user | Excel or Power BI analyst | Analyst or data engineer | Python analyst or data scientist |
| Repeatability | Refresh the saved query | Rerun the script | Rerun the script or notebook |
| Version control | Possible via the M script; steps are stored in the workbook or report | Plain-text files diff cleanly | Plain-text files diff cleanly |
| Automated tests | No built-in test runner; check results manually or with extra queries | dbt tests or assertion queries | pytest and similar |
| Missing values | null |
NULL with three-valued logic |
NaN, NaT or pd.NA depending on type |
| Cost | Comes with Excel and Power BI; needs one of those products | DuckDB is free and open source | Free and open source |
| Best at | Recurring file prep for business users | Large tables, joins, set-based rules | Complex logic, Python integration |
Power Query is available in Excel for Windows and Mac, Power BI, Power Apps, Azure Data Factory, Data Factory in Microsoft Fabric and several other Microsoft products, and all of its transformations are written in the M formula language (Microsoft Learn, What is Power Query?).
The same cleaning task in each tool
Take a small customer extract with the usual problems: a name with padding, an amount of n/a, an ID with leading zeros, and two versions of customer 00017 where only the latest should survive.
customer_id,name,amount,updated_at
00017, Ana Silva ,19.90,2026-03-01
00017,Ana Silva,21.50,2026-03-09
00042,Ben Okafor,n/a,2026-03-02
00058,Chloé Martin,12.00,2026-03-04
Power Query
In Power Query the job is a sequence of applied steps built from the ribbon:
- Data > From Text/CSV, then Transform Data. Set
customer_idto Text so the leading zeros survive. - Select
name, then Transform > Format > Trim. - Change
amountto a decimal type. Then/acell becomes an Error value; use Replace Errors withnull, or keep the errors and filter them into a separate exceptions query. - Keep the latest row per customer. There is no single "keep latest" command; a common approach is Group By on
customer_idwith the maximumupdated_at, then merge back to the original rows. Check the result against a customer you know.
Each step appears in the Applied Steps pane, and the whole query reruns when you refresh.
SQL (DuckDB)
SELECT customer_id,
       trim(name)                        AS name,
       TRY_CAST(amount AS DECIMAL(10,2)) AS amount,
       CAST(updated_at AS DATE)          AS updated_at
FROM read_csv('customers.csv', all_varchar = true)
QUALIFY row_number() OVER (PARTITION BY customer_id ORDER BY updated_at DESC) = 1
ORDER BY customer_id;
┌─────────────┬──────────────┬───────────────┬────────────┐
│ customer_id │     name     │    amount     │ updated_at │
│   varchar   │   varchar    │ decimal(10,2) │    date    │
├─────────────┼──────────────┼───────────────┼────────────┤
│ 00017       │ Ana Silva    │         21.50 │ 2026-03-09 │
│ 00042       │ Ben Okafor   │          NULL │ 2026-03-02 │
│ 00058       │ Chloé Martin │         12.00 │ 2026-03-04 │
└─────────────┴──────────────┴───────────────┴────────────┘
QUALIFY filters on a window function, so "keep the latest row per customer" is one line, and the ORDER BY updated_at DESC states which row survives (DuckDB, QUALIFY clause).
pandas
import pandas as pd

df = pd.read_csv("customers.csv", dtype="string")
df["name"] = df["name"].str.strip()
df["amount"] = pd.to_numeric(df["amount"], errors="coerce")
df["updated_at"] = pd.to_datetime(df["updated_at"], format="%Y-%m-%d")

latest = (df.sort_values(["customer_id", "updated_at"])
            .drop_duplicates(subset="customer_id", keep="last")
            .reset_index(drop=True))
print(latest)
  customer_id          name  amount updated_at
0       00017     Ana Silva    21.5 2026-03-09
1       00042    Ben Okafor    <NA> 2026-03-02
2       00058  Chloé Martin    12.0 2026-03-04
drop_duplicates keeps the first occurrence by default (pandas, DataFrame.drop_duplicates), so the sort plus keep="last" is what makes the latest row win. Without the explicit sort, the survivor depends on file order.
All three produce the same table. What differs is how you express the rule, and how visible the rule is to the next person.
Where the tools give different answers
The syntax differences are easy. The behavioural differences are what catch people moving between tools. The first three cases below compare SQL and pandas, the two code-based options; the last one covers all three tools.
Missing values in comparisons
In SQL, comparing a missing value to anything gives NULL, not false:
SELECT NULL = 'a' AS cmp; -- returns NULL
In pandas, the same comparison on a column with the default str dtype (or object) returns False for the missing entry:
pd.Series(["a", None]).eq("a").tolist() # [True, False]
A SQL WHERE status <> 'cancelled' silently drops rows where status is missing, because NULL <> 'cancelled' is not true. With the default str dtype, the pandas filter df[df.status != 'cancelled'] keeps them. The nullable "string" dtype behaves like SQL instead: the comparison returns <NA> and the boolean filter drops the row. So the same rule can give different row counts depending on the tool and even on the pandas dtype; test it on a row with a missing value.
Totals of nothing
Summing a column where every value is missing gives 0.0 in pandas and NULL in SQL. "No data" and "zero" are different facts, and only SQL keeps them apart by default.
Missing keys in group-by
pandas drops rows with a missing group key unless you ask it not to; dropna=True is the default for groupby (pandas, DataFrame.groupby). SQL keeps them as their own group:
orders = pd.DataFrame({"region": ["North", None, "North", None],
                       "amount": [10, 5, 7, 3]})
orders.groupby("region")["amount"].sum()               # North 17   (the 8 with no region vanish)
orders.groupby("region", dropna=False)["amount"].sum() # North 17, NaN 8
-- DuckDB can query the pandas DataFrame `orders` directly from Python
SELECT region, sum(amount) FROM orders GROUP BY region;  -- North 17, NULL 8
If the totals are meant to reconcile with the source, the pandas default loses money from the report. The lesson on overriding the pandas defaults that change your data lists the settings worth changing, and the guide to SQL versus pandas cleaning differences covers more cases like these.
Type conversion failures
Each tool treats a value that will not convert in its own way. Power Query marks the cell as an Error value. DuckDB's TRY_CAST (SQL Server and Snowflake have one too) returns NULL, while a plain CAST stops the query. pandas to_numeric raises an exception by default and returns a missing value with errors="coerce". In every case, count the failures before moving on, or they turn into silent gaps.
How to choose between Power Query, SQL and pandas
Use Power Query when:
- the people who build and own the cleaning live in Excel or Power BI;
- the job is recurring preparation of files or extracts that feed a report;
- the transformations are standard and a reviewer needs to read the steps without reading code.
Use SQL when:
- the data already sits in a database, a warehouse or files that DuckDB can query directly;
- rules are set-based (filter, join, deduplicate, aggregate) and must be reviewed as text;
- the cleaned table feeds other pipelines or many users.
Use pandas when:
- the rest of the work (analysis, statistics, modelling) is in Python;
- the logic needs loops, custom functions, external libraries or API calls;
- you want unit tests around cleaning functions in the same codebase.
Two practical notes. First, Power Query works against databases more efficiently when its steps fold into source queries, but Microsoft notes that file sources such as CSV and Excel do not support folding, so every step on them runs in the Power Query engine itself (Microsoft Learn, query folding). Second, SQL and pandas are no longer an either-or choice: DuckDB can query a pandas DataFrame directly from Python, so a team can write set-based rules in SQL and keep the rest of its workflow in pandas.
If you want to build the same skills in either language, the SQL analyst path and the pandas practitioner path cover the same cleaning problems with graded exercises. The free pick a surviving record exercise is a good place to compare how deduplication feels in each.
Frequently asked questions
Is Power Query better than SQL for data cleaning?
For an Excel or Power BI user preparing recurring files, often yes: it needs no code and the steps refresh automatically. For large data, shared pipelines or rules that need code review, SQL is usually the better fit. Power Query can also push work into a SQL database through query folding, so the two are often used together.
Should I learn SQL or pandas first for data cleaning?
Learn the one closest to where your data and team are. If your data lives in databases or you work alongside analysts who write queries, start with SQL. If you already use Python for analysis, start with pandas. The cleaning concepts (types, missing values, survivor rules, joins) carry over between them.
Can pandas handle large datasets?
pandas loads data into memory, so it works well up to sizes that fit comfortably in RAM. For larger files, querying them with DuckDB (from Python, alongside pandas) or processing them in chunks avoids loading everything at once.
Why do my totals differ between pandas and SQL?
The most common causes are missing values: pandas drops missing group keys by default and sums an all-missing column to 0, while SQL keeps a NULL group and returns NULL for an empty sum. Check row counts per group in both before comparing totals.
Related reading
- Moving Data Cleaning From Excel to SQL: A Translation Guide
- Visual Data Cleaning Pipelines: When a No-Code Approach Makes Sense
- How to Clean Data With pandas: A Step-by-Step Walkthrough
Sources
- Microsoft Learn. What is Power Query?
- Microsoft Learn. Understanding query evaluation and query folding in Power Query.
- DuckDB. QUALIFY clause.
- pandas. DataFrame.drop_duplicates.
- pandas. DataFrame.groupby.