Visual Data Cleaning Pipelines: When a No-Code Approach Makes Sense
When a visual, step-by-step cleaning pipeline is the right tool, when to move to SQL or pandas, and how to build one that others can review and rerun.
By Tnas · Published · 8 min read
A visual data cleaning pipeline makes sense when the work is made of standard steps (trim, convert types, map categories, filter, deduplicate, join, pivot). It also fits when the people who need to build or check it do not write code, and when the same preparation has to run again on new files. It stops making sense when the rules become heavily conditional, when you need code review and automated tests, or when the data outgrows the tool.
The useful question is not "code or no code" but "is the pipeline a recorded, repeatable sequence of rules?" A visual pipeline that records every step is far closer to a SQL script than to a spreadsheet full of manual edits.
Key Takeaways
- A visual pipeline is a list of typed steps applied in order to an untouched source. That makes it repeatable, which hand-edited spreadsheets are not.
- It fits standard transformations, non-coding reviewers, recurring file preparation and learning the logic of cleaning.
- Move to SQL or pandas when you need version control with readable diffs, automated tests, complex conditional rules or larger data.
- Build visual pipelines the way you would write code: one decision per step, types set early, and an exceptions output instead of silent deletes.
- Many visual tools generate code underneath. Treat that code as the real record of the pipeline.
What is a visual data cleaning pipeline?
A visual pipeline is an ordered set of steps, each one a named transformation with settings, applied to a source that is never edited. You build it by choosing operations from a menu or connecting boxes on a canvas rather than typing code. The pipeline itself is the record of what was done.
Two widely used examples show the pattern:
- Power Query (in Excel, Power BI and Microsoft Fabric) records each transformation as an applied step and replays the steps on refresh. Microsoft describes it as recording transformations as query steps without modifying the source data, and every step is written behind the scenes in the Power Query M formula language (Microsoft Learn, What is Power Query?).
- KNIME Analytics Platform builds workflows by dragging nodes onto a canvas, connecting their ports, and configuring and executing each node (KNIME, Analytics Platform User Guide).
The visual builder used for practice on this site follows the same idea in a smaller form: you add typed steps such as trim, convert, validate, deduplicate, join and pivot, and each step reports which rows it changed or quarantined.
When a visual pipeline is the right choice
The steps are standard transformations
Most cleaning work is a small set of operations applied with care: trim whitespace, convert a column's type, map spellings to an approved list, fill or flag missing values, remove duplicates under a survivor rule, look up values from another table, pivot or unpivot. Visual tools cover these well. Power Query alone offers over 350 types of data transformation according to Microsoft (What is Power Query?). If your job fits inside that vocabulary, writing code adds little.
The reviewers do not write code
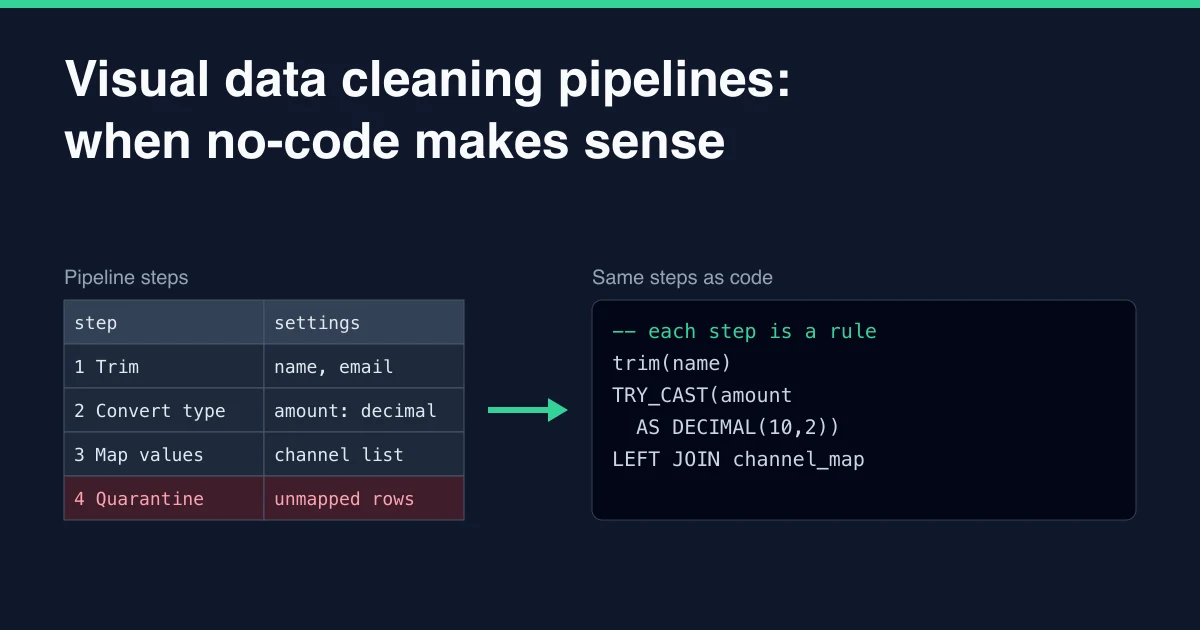
A finance analyst or operations lead can read a list of steps such as "Trim name and email", "Convert amount to decimal", "Map channel using approved list" and say whether it matches the business rule. Few of them can review the equivalent pandas script. When the person who owns the rule is not a programmer, a visual pipeline lets them check the logic directly, which is often worth more than any technical advantage of code.
The same preparation repeats
Monthly supplier files, weekly CRM exports and recurring survey downloads are a strong fit. Build the steps once against one file, then refresh against the next. Power Query, for example, saves the steps as a query that can be refreshed when new data arrives (What is Power Query?). The repeatability is the point; it is what separates a pipeline from a one-off clean-up.
You are learning the logic of cleaning
A visual builder makes the order of operations visible. You see that trimming must come before mapping (otherwise "Email " fails to match "email"), that types should be set before validation, and that a lookup can fail. Once the steps make sense visually, SQL or pandas is mostly new syntax for ideas you already hold. The beginner visual learning path is built around exactly that progression, and the visual practice area lets you build pipelines against graded exercises.
When to move to SQL or pandas
Visual pipelines have real limits. These are the signals that code will serve you better:
| Signal | Why code helps |
|---|---|
| Rules have many nested conditions | A CASE expression or a Python function is easier to read than a stack of conditional columns |
| You need code review and readable diffs | A text file in version control shows exactly what changed between versions |
| You need automated tests | Test frameworks run cleaning rules against known inputs on every change |
| Data is large or lives in a database | SQL runs where the data is; desktop tools pull it to the local machine |
| The pipeline feeds other systems | Scheduled jobs, orchestration and deployment tools expect code |
The data-size point has a concrete form in Power Query. It tries to "fold" steps into queries that the source database runs itself, but Microsoft notes that sources without a query engine, such as CSV and Excel files, don't support query folding, so every step on those files runs in the Power Query engine rather than at the source, which in Excel or Power BI Desktop means on your own machine (Microsoft Learn, Query evaluation and query folding). How large a file you can handle comfortably then depends on the machine or service running that engine.
None of this means a visual pipeline was a mistake. A pipeline that has been built visually and checked by the rule owner is an excellent specification for the code version.
The same pipeline as code
Here is the four-step pipeline from the diagram written as DuckDB SQL. Each common table expression is one visual step, in the same order, and the final SELECT is the quarantine step:
WITH step1_trim AS (
  SELECT trim(name) AS name, trim(email) AS email, amount, channel
  FROM signups
),
step2_types AS (
  SELECT *, TRY_CAST(amount AS DECIMAL(10,2)) AS amount_num
  FROM step1_trim
),
step3_map AS (
  SELECT s.*, m.channel_clean
  FROM step2_types AS s
  LEFT JOIN channel_map AS m ON lower(s.channel) = m.raw_value
)
SELECT name, email, amount_num, channel_clean,
       CASE WHEN amount_num IS NULL    THEN 'amount not a number'
            WHEN channel_clean IS NULL THEN 'channel not in dictionary'
       END AS quarantine_reason
FROM step3_map
ORDER BY name;
┌──────────────┬───────────────────┬───────────────┬───────────────┬───────────────────────────┐
│     name     │       email       │  amount_num   │ channel_clean │     quarantine_reason     │
│   varchar    │      varchar      │ decimal(10,2) │    varchar    │          varchar          │
├──────────────┼───────────────────┼───────────────┼───────────────┼───────────────────────────┤
│ Ana Silva    │ ana@example.com   │         19.90 │ Email         │ NULL                      │
│ Ben Okafor   │ ben@example.com   │          NULL │ Paid search   │ amount not a number       │
│ Chloé Martin │ chloe@example.com │         12.00 │ NULL          │ channel not in dictionary │
└──────────────┴───────────────────┴───────────────┴───────────────┴───────────────────────────┘
The input had padded names, an n/a amount and a channel ("Tiktok") missing from the approved list. The result keeps every row and gives each failing one a reason. A visual tool that shows a per-step ledger of changed and quarantined rows gives you the same information without the SQL. The point of seeing both is that the logic is identical; only the editor differs.
How to build a visual pipeline others can trust
The habits that make code trustworthy apply equally to visual pipelines:
- One decision per step. "Trim name and email" and "Map channel" should be separate steps, so a reviewer can check each against its rule.
- Name steps after the rule, not the click. "Map channel using approved list v3" says more than "Replaced Values 2".
- Set types early and explicitly. Read identifiers as text and convert numbers and dates on purpose, before any validation step depends on them.
- Route failures to an exceptions output. Filtering out bad rows hides them. Send them to a separate table with a reason so someone can act. The lesson on quarantine with reasons shows the pattern.
- Never mix in manual edits. A pipeline plus three hand-corrected cells is no longer repeatable.
- Check it runs twice. Run the pipeline on its own output, or rerun on the same input, and confirm nothing changes. That property is called idempotency, and the guide to reproducible cleaning pipelines explains why it matters.
- Keep the generated code. If the tool exposes code (Power Query's Advanced Editor shows the M script), save it alongside the pipeline so changes can be compared over time.
A good first test of these habits is the free map categories with an approved dictionary exercise, which asks you to map values and quarantine what the dictionary does not cover, using the visual builder.
Frequently asked questions
Is a visual pipeline less rigorous than code?
Not inherently. Rigour comes from recording every step, running it on untouched source data, and handling exceptions explicitly. A visual pipeline that does those things is more rigorous than an undocumented script. Code pulls ahead when you need tests, readable diffs and review at scale.
Can a visual pipeline handle large datasets?
It depends on the tool and where it runs. Power Query cannot fold steps back to CSV or Excel sources, so all transformations run in its own engine: on your machine in Excel or Power BI Desktop, or in the service for cloud dataflows. For data that lives in a database, SQL that runs inside the database usually scales better.
Should beginners start with a visual tool or with SQL?
Either works. Starting visually makes the order of cleaning steps and the effect of each one easy to see, which builds the right habits. Moving to SQL or pandas afterwards is mostly a matter of learning syntax for steps you already understand.
Related reading
- Power Query vs SQL vs pandas for Data Cleaning
- How to Document a Data Cleaning Pipeline So Others Can Trust It
- How to Practice Data Cleaning: 7 Ways to Build Real Skill
Sources
- Microsoft Learn. What is Power Query?
- Microsoft Learn. Understanding query evaluation and query folding in Power Query.
- KNIME. KNIME Analytics Platform User Guide.