Data Cleaning vs Data Transformation: Where One Ends and the Other Begins
Data cleaning makes values correct; data transformation reshapes correct data for a use. See the boundary, the gray areas and why the order changes your totals.
By Tnas · Published · 9 min read
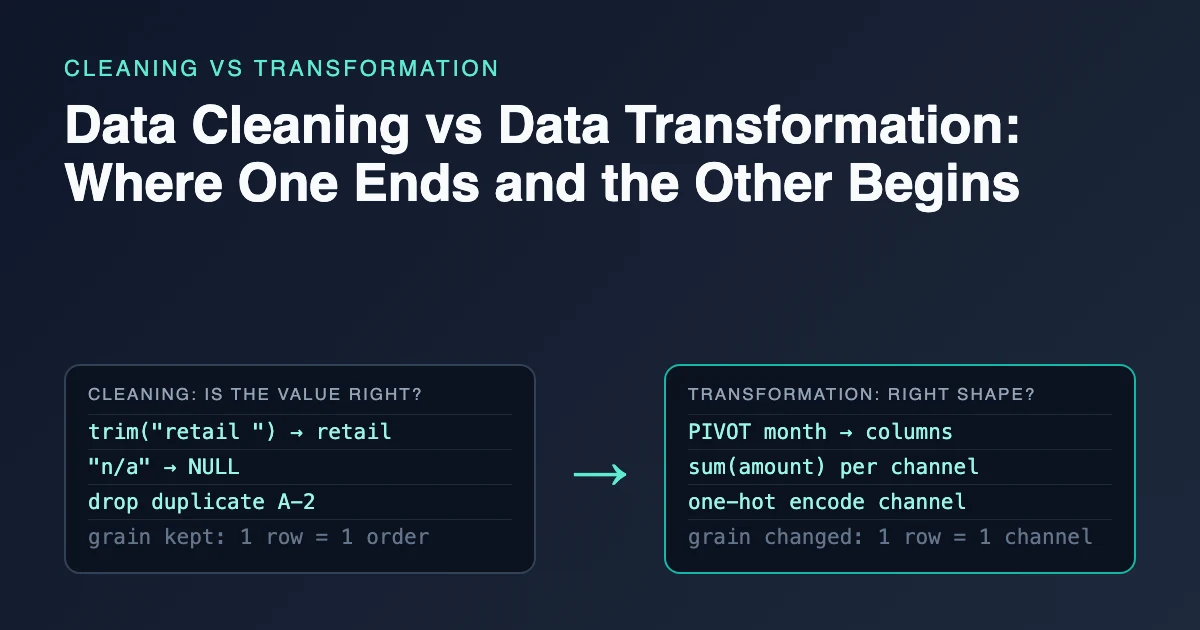
Data cleaning means making the values in a dataset correct and consistent without changing what a row means. Data transformation means changing the shape, grain or representation of correct data. It makes that data suit a specific report, model or system. Trimming "retail " to "retail" is cleaning. Pivoting order lines into one column per month is transformation. The boundary matters because transforming data before it is clean multiplies its errors, and the totals look plausible either way.
Key Takeaways
- Cleaning asks "is this value right?"; transformation asks "is this data in the shape my use needs?"
- Cleaning keeps the row grain and meaning of the source. Transformation may change them, for example by aggregating, pivoting or joining.
- Clean first, transform second. A pivot run on uncleaned order data in the example below splits one channel into two rows and counts a duplicate order twice.
- Some steps sit on the line, such as type conversion and filling missing values. Decide by asking whether the step repairs the source or serves one consumer.
- Pipeline conventions encode the same split: dbt's staging models rename, cast and categorize but avoid joins and aggregations.
What is the difference between data cleaning and data transformation?
The difference is the question each step answers. (If you are new to the first half, start with what data cleaning is, with examples.) Cleaning answers "does this value correctly represent what happened?" Transformation answers "how should correct data be arranged for this purpose?"
A useful test is to imagine three different teams using the same source table: finance, marketing and a machine-learning project. A cleaning rule such as "order IDs are unique" or "channel names are lowercase and trimmed" helps all three, because it repairs the source. A transformation such as "monthly revenue per channel" or "one-hot encoded channel columns" helps only the team that asked for it. Cleaning is source-facing; transformation is consumer-facing.
| Data cleaning | Data transformation | |
|---|---|---|
| Goal | Make values correct and consistent | Make correct data fit a specific use |
| Row grain | Kept (one row still means one order) | Often changed (one row per month, per customer) |
| Typical steps | Trim, fix types, standardize categories, handle missing values, deduplicate, validate | Aggregate, pivot and unpivot, join for enrichment, derive columns, encode, scale |
| Who benefits | Every downstream user | The report, model or system it was built for |
| Typical output | A clean table plus an exceptions table | A report table, feature matrix or target schema |
| Failure looks like | Wrong values, hidden duplicates, silent drops | Wrong grain, double counting, leakage, lost gaps |
Not everyone draws the line in the same place. IBM's overview of data transformation lists data cleaning as one step inside the transformation process. By that definition, the "T" in ETL and ELT covers both. That is fine as vocabulary, but inside a pipeline you still want the two kinds of step kept apart, for the reasons below.
What counts as data cleaning?
Data cleaning covers every step that repairs the source data without changing what a row represents. The common ones:
- Text standardization: trimming whitespace, applying a case policy, normalizing Unicode and mapping spelling variants to one approved value.
- Type repair: parsing text into real dates, exact decimals and booleans, with values that fail to parse sent to exceptions instead of silently becoming null.
- Missing values: turning blanks and placeholder codes such as
N/Aor-999into real nulls, as covered in sentinel values are missing values in disguise. - Deduplication: removing copies of the same record under a stated survivor rule, at the table's real row grain.
- Validation: checking ranges, allowed values and cross-field rules, and quarantining rows that fail with a reason.
None of these change the grain. After cleaning, an orders table is still one row per order, just with values you can trust.
What counts as data transformation?
Data transformation covers steps that rearrange or extend correct data for a particular purpose. The common ones:
- Aggregation: collapsing order lines into totals per day, customer or channel.
- Reshaping: pivoting long data to wide or unpivoting wide data to long. The guide to pivoting and unpivoting without inventing data covers the traps.
- Enrichment joins: adding product names or region attributes from a lookup table.
- Derived columns: computing margin, age bands, fiscal quarters or flags such as "first order".
- Model preparation: one-hot encoding categories, scaling numbers and imputing values with statistics learned from training data.
Each of these produces a new table designed for one consumer. Each also assumes its input is already clean.
Why should you clean before you transform?
Cleaning comes first because a transformation multiplies whatever errors its input contains. Here is a six-row order extract with a duplicated order, inconsistent channel names and an amount recorded as n/a:
CREATE TABLE raw_orders AS SELECT * FROM (VALUES
  ('A-1', 'Retail',    '2026-01-14', '120.00'),
  ('A-2', 'retail ',   '2026-01-20', '80.00'),
  ('A-2', 'retail ',   '2026-01-20', '80.00'),
  ('A-3', 'Online',    '2026-02-03', '45.50'),
  ('A-4', 'online',    '2026-02-11', 'n/a'),
  ('A-5', 'Wholesale', '2026-02-17', '300.00')
) AS t(order_id, channel, order_date, amount);
Transform first: a pivot on raw data
Pivoting straight away, to get revenue per channel per month in DuckDB:
PIVOT (
  SELECT channel,
         strftime(CAST(order_date AS DATE), '%Y-%m') AS month,
         TRY_CAST(amount AS DECIMAL(10,2))           AS amount
  FROM raw_orders
)
ON month USING sum(amount)
GROUP BY channel
ORDER BY channel;
┌───────────┬─────────┬─────────┐
│  channel  │ 2026-01 │ 2026-02 │
├───────────┼─────────┼─────────┤
│ Online    │    NULL │   45.50 │
│ Retail    │  120.00 │    NULL │
│ Wholesale │    NULL │  300.00 │
│ online    │    NULL │    NULL │
│ retail    │  160.00 │    NULL │
└───────────┴─────────┴─────────┘
The report has five channels instead of three. Retail revenue is split across two rows, and the retail row (stored as "retail ", with a trailing space) shows 160.00 because order A-2 was counted twice. Nothing errored, and every number is a real sum of real rows.
Clean first, then the same pivot
Cleaning first takes four rules: trim and lowercase the channel, parse the date, parse the amount, and remove rows that are duplicates once those values are normalized:
CREATE TABLE clean_orders AS
SELECT DISTINCT
  order_id,
  lower(trim(channel))               AS channel,
  CAST(order_date AS DATE)           AS order_date,
  TRY_CAST(amount AS DECIMAL(10,2))  AS amount
FROM raw_orders;

PIVOT (
  SELECT channel, strftime(order_date, '%Y-%m') AS month, amount
  FROM clean_orders
)
ON month USING sum(amount)
GROUP BY channel
ORDER BY channel;
┌───────────┬─────────┬─────────┐
│  channel  │ 2026-01 │ 2026-02 │
├───────────┼─────────┼─────────┤
│ online    │    NULL │   45.50 │
│ retail    │  200.00 │    NULL │
│ wholesale │    NULL │  300.00 │
└───────────┴─────────┴─────────┘
Three channels, and January retail is 200.00 (120.00 + 80.00), with A-2 counted once.
One problem remains. TRY_CAST turned order A-4's n/a amount into NULL, so online's February total of 45.50 silently excludes it. A complete cleaning step also records that row in an exceptions table, with a reason:
SELECT DISTINCT order_id, amount AS raw_amount, 'amount is not a number' AS reason
FROM raw_orders
WHERE amount IS NOT NULL
  AND TRY_CAST(amount AS DECIMAL(10,2)) IS NULL;
┌──────────┬────────────┬────────────────────────┐
│ order_id │ raw_amount │         reason         │
├──────────┼────────────┼────────────────────────┤
│ A-4      │ n/a        │ amount is not a number │
└──────────┴────────────┴────────────────────────┘
The report can then state that one February online order has no usable amount, instead of letting the sum imply completeness. The lesson on reporting coverage with every number shows how.
These results come from running the queries in DuckDB 1.5.1, with the type rows removed and the columns narrowed for readability.
The same problem in model preparation
Encoding has the same trap. In pandas 3.0, get_dummies on an uncleaned channel column creates one indicator column per spelling:
import pandas as pd

orders = pd.DataFrame({"channel": ["Retail", "retail ", "Online", "online"]}, dtype="string")
print(pd.get_dummies(orders["channel"]).columns.tolist())
print(pd.get_dummies(orders["channel"].str.strip().str.lower()).columns.tolist())
['Online', 'Retail', 'online', 'retail ']
['online', 'retail']
A model trained on the first version learns four channels where the business has two.
Which steps sit on the boundary?
A few steps can be either cleaning or transformation, depending on why you run them. The test is the same each time: does the step repair the source, or serve one consumer?
| Step | Cleaning when… | Transformation when… |
|---|---|---|
| Type conversion | Parsing "2026-03-04" text into the date it always represented |
Converting a timestamp to a reporting time zone or week number |
| Unit changes | Fixing rows recorded in cents when the column is defined in dollars | Expressing all prices in a reporting currency |
| Filling missing values | Restoring a value from a documented rule, such as a known default | Imputing with a mean or median for a model |
| Joins | Checking that every order's customer exists (referential integrity) | Adding customer attributes to orders for a report |
| Grouping values | Mapping "e-mail" and "Email" to one approved category |
Bucketing ages into bands for a chart |
| Deduplication | Removing exact copies of one event | Keeping only each customer's latest order for an analysis |
Imputation is the misfiled step most likely to leak information into a model (the trade-offs between methods are compared in imputing missing values: mean, median, model or nothing). A median learned from the whole dataset leaks information from test rows into training, which is why the guide to avoiding leakage in data preparation treats it as a modeling step that comes after the train/test split, not as cleaning.
How do data pipelines separate the two?
Pipeline conventions encode the same boundary in their layer names. dbt's guide to structuring projects describes staging models, the first layer built on raw sources. Their standard operations are renaming, type casting, basic computations such as cents to dollars, and categorizing. Joins and aggregations are marked as things to avoid at that stage (dbt Labs, "Staging: Preparing our atomic building blocks"). Grain-changing work happens in later models.
Databricks describes a similar layering in its medallion architecture. Data in the Silver layer is "matched, merged, conformed and cleansed", while the Gold layer holds consumption-ready, project-specific tables for reporting (Databricks, "Medallion Architecture"). Silver is roughly where cleaning finishes; Gold is transformation for a use.
The practical rule for your own work is the same: produce one clean, validated table at the source grain, then build each report or feature set from that table. When a number in a report looks wrong, you can then check the clean layer first and know whether the problem is in the data or in the transformation.
Frequently asked questions
Is data cleaning part of data transformation?
It depends on whose vocabulary you use. IBM's overview lists data cleaning as one step of the data transformation process, and in that sense the "T" in ETL includes it. Inside your own pipeline, keep them as separate steps anyway. Cleaning rules and reshaping logic fail in different ways, so separate steps are easier to test.
Is normalization cleaning or transformation?
It depends which normalization you mean. Unicode normalization of text, such as converting decomposed accents to composed ones, is cleaning. Min-max scaling of a numeric feature is transformation for a model. Database normalization, splitting data into related tables, is data modeling.
Is feature engineering data transformation?
Yes. Feature engineering creates new columns, encodings and aggregates for a specific model, which makes it transformation. It should start from cleaned data and learn any statistics, such as means for scaling, from training data only.
Can one SQL query do both?
It can, and short ad hoc queries often do. For anything that runs repeatedly, split the work: a cleaning step that produces a validated table, then transformation queries that read from it. You can then rerun, test and reconcile each part on its own.
Practice the boundary
A good way to see the difference is to do both on the same data. Try totaling before you pivot, then pivoting monthly values while keeping zeros and gaps apart, and finish with mapping channels with an approved dictionary, the cleaning step that has to happen before any channel can be grouped, pivoted or encoded.
Related reading
- Data Wrangling, Data Cleaning and Data Munging: What's the Difference?
- Scaling and Encoding Are Not Cleaning: Getting the Order of Data Prep Right
Sources
- IBM Think. What is data transformation? Retrieved 2026-11-05.
- dbt Labs. Staging: Preparing our atomic building blocks. dbt Developer Hub, retrieved 2026-11-05.
- Databricks. Medallion Architecture. Databricks Glossary, retrieved 2026-11-05.