pandas fillna Without Regret: When Filling Missing Values Is Wrong
When pandas fillna helps and when it quietly changes your results: zeros that skew averages, forward fills across groups, sentinels and leaky medians.
By Tnas · Published · 7 min read
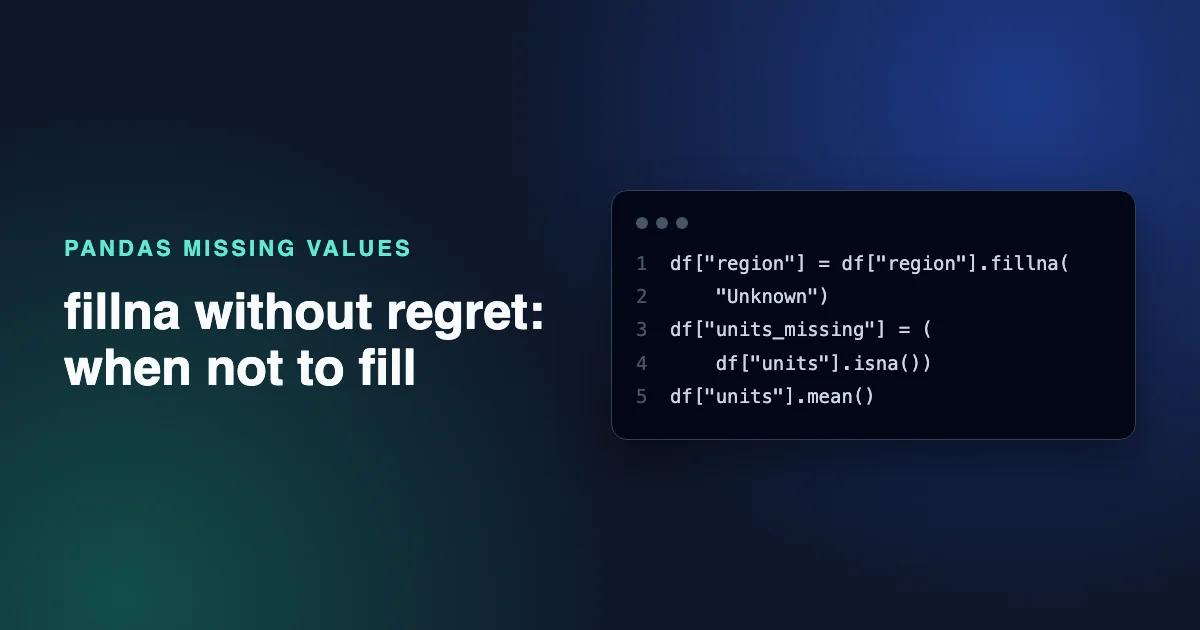
Filling missing values with pandas fillna is wrong whenever the filled value claims something the data doesn't know. Filling a missing measurement with 0 says "we counted and there were none". Filling with the column mean says "this one was typical". Forward-filling says "nothing changed since the last row". Sometimes those statements are true, and often they aren't. A good rule of thumb: fill labels, keep measurements missing, and fill with zero only when zero is the real answer.
This post shows the common fillna mistakes, what each one does to your numbers, and the cases where filling is the right call. Every snippet was run on pandas 3.0.2, and the outputs are copied from those runs.
Key Takeaways
fillna(0)on a measurement changes its average and count: in the example below, mean units drop from 10.0 to 5.0.- Filling a category with an explicit label such as
"Unknown"is usually safe, because the label says what you don't know.ffill()copies values in row order and across groups unless you sort and usegroupby(...).ffill().- Sentinel codes are placeholders like
-999that pandas does not treat as missing. Replace them with a real missing value before any fill or summary.- Zero is correct for counts of events that didn't happen, such as a day with no orders.
What fillna does
fillna replaces missing values with a scalar, or with per-column values when you pass a dictionary (pandas DataFrame.fillna documentation). For filling from neighbouring rows, use ffill() and bfill() (DataFrame.ffill documentation). Since pandas 3.0, the old fillna(method="ffill") form no longer works:
import pandas as pd

pd.Series([1.0, None]).fillna(method="ffill")
TypeError: NDFrame.fillna() got an unexpected keyword argument 'method'
The mechanics are simple. The hard part is deciding whether any fill value is honest. The pandas user guide on working with missing data covers how missing values are represented. The rest of this post is about when to leave them alone.
Mistake 1: Filling measurements with zero
A missing measurement means "not recorded". Zero means "recorded, and it was zero". Mixing them up changes every summary built on the column.
sales = pd.DataFrame({
    "store": ["S1", "S2", "S3", "S4"],
    "region": ["North", None, "South", "South"],
    "units": [12, None, 8, None],
})
print(sales["units"].mean(), sales["units"].count())

filled = sales["units"].fillna(0)
print(filled.mean(), filled.count())
10.0 2
5.0 4
Before the fill, the average is 10 units across the two stores that reported. After it, the average is 5 units across four stores, two of which never reported anything. The sum didn't change, which is why this mistake often slips through review. Any mean, median, minimum or rate built on the column did change.
Fill labels, keep measurements missing
For a category, an explicit label is honest: "Unknown" says exactly what you know. For a measurement, keep the value missing and add a flag column so the gap stays visible.
out = sales.assign(
    region=sales["region"].fillna("Unknown"),
    units_missing=sales["units"].isna(),
)
print(out)
  store   region  units  units_missing
0    S1    North   12.0          False
1    S2  Unknown    NaN           True
2    S3    South    8.0          False
3    S4    South    NaN           True
Now a group-by on region doesn't drop store S2, and an average of units covers only stores that reported. When you publish that average, also report how many stores it covers. The lesson Fill labels, not measurements explains the reasoning, and the free exercise Label unknown categories, keep missing numbers missing is graded on exactly this split.
Mistake 2: Forward-filling unordered rows
ffill() copies the last non-missing value downward in the current row order. If the rows aren't sorted, or several groups are stacked together, it copies values between unrelated rows:
r = pd.DataFrame({
    "sensor": ["A", "B", "A", "B", "A"],
    "read_at": pd.to_datetime(["2026-06-01 10:00", "2026-06-01 09:00",
                               "2026-06-01 09:00", "2026-06-01 10:00",
                               "2026-06-01 11:00"]),
    "temp": [21.5, 18.0, None, None, 22.0],
})
print(r.ffill())
  sensor             read_at  temp
0      A 2026-06-01 10:00:00  21.5
1      B 2026-06-01 09:00:00  18.0
2      A 2026-06-01 09:00:00  18.0
3      B 2026-06-01 10:00:00  18.0
4      A 2026-06-01 11:00:00  22.0
Sensor A's 09:00 reading was filled with 18.0 from sensor B. Sort by group and time, then fill within each group:
fixed = (r.sort_values(["sensor", "read_at"])
          .assign(temp=lambda d: d.groupby("sensor")["temp"].ffill()))
print(fixed)
  sensor             read_at  temp
2      A 2026-06-01 09:00:00   NaN
0      A 2026-06-01 10:00:00  21.5
4      A 2026-06-01 11:00:00  22.0
1      B 2026-06-01 09:00:00  18.0
3      B 2026-06-01 10:00:00  18.0
Sensor A's first reading stays missing because nothing came before it. Even the correct version is a claim that sensor B's temperature didn't change between 09:00 and 10:00. Forward-filling suits values that persist until changed, such as a customer's plan or a price list. It suits independent measurements, such as readings or sales, much less well. When row order carries no meaning at all, don't fill down: report the blanks instead. The exercise Don't fill down unordered rows is built around that case.
Mistake 3: Filling around sentinel values
Many systems write a numeric code such as -999 or 9999 instead of leaving a field empty. read_csv already treats text markers such as N/A, NA and null as missing by default, but it doesn't know what your numeric codes mean, so fillna skips them and every summary includes them:
import numpy as np

t = pd.Series([21.5, -999.0, 22.0])
print(t.fillna(t.mean()).mean(), t.isna().sum())

t2 = t.replace(-999.0, np.nan)
print(t2.isna().sum(), t2.mean())
-318.5 0
1 21.75
The first line reports an average temperature of -318.5 and zero missing values. After replacing the sentinel, pandas sees one missing value and the average is 21.75. Check the data dictionary or a frequency table for codes like these before you fill anything. When you know the codes up front, declare them at read time with pd.read_csv(path, na_values=[-999, 9999]) (read_csv documentation). Sentinel values are missing values in disguise lists the usual suspects.
Mistake 4: Filling with a statistic from all the data
Filling with the mean or median is a modelling choice called imputation. If the data will be used to train and test a model, compute the statistic on the training rows only, then apply it to both:
train = pd.Series([10.0, 12.0, None, 14.0])
test = pd.Series([30.0, None, 32.0])

med = train.median()
print(med, test.fillna(med).tolist())
print(pd.concat([train, test]).median())
12.0 [30.0, 12.0, 32.0]
14.0
The training median is 12.0. A median taken across both sets is 14.0, which lets information from the test rows into the training data. Keep a missing-value indicator next to the imputed column too, so a model or an analyst can tell real values from filled ones. The exercise Impute with an indicator column practises this pattern.
When filling is the right call
Filling isn't always wrong. It is correct when the fill value is a fact, not a guess:
| Situation | Fill? | Why |
|---|---|---|
| Category unknown | Yes, with "Unknown" |
The label states what is known |
| Count of events on a day with none | Yes, with 0 |
No events happened, so zero is the fact |
| Measurement not recorded | No, add a flag | Zero or a mean would invent data |
| Status that persists until changed | Yes, groupby().ffill() after sorting |
The last state is still the state |
| Model feature | Yes, with a training-only statistic plus an indicator | Avoids leakage, keeps the gap visible |
| Sentinel code | Replace with missing first | A fill can't fix a value pandas thinks is real |
Counts are the clearest case. Grouping orders by day leaves out days with no orders, and those days should show zero, not be missing:
orders = pd.DataFrame({"day": ["2026-07-01", "2026-07-01", "2026-07-03"],
                       "order_id": [1, 2, 3]})
days = pd.Index(["2026-07-01", "2026-07-02", "2026-07-03"], name="day")
counts = orders.groupby("day").size().reindex(days, fill_value=0)
print(counts)
day
2026-07-01    2
2026-07-02    0
2026-07-03    1
dtype: int64
Here fill_value=0 is right because no rows for 2 July means no orders on 2 July. Compare that with Mistake 1, where no value for a store meant nobody reported. For more on telling these apart, see Null, blank and zero.
Frequently asked questions
Should I fill NaN with 0 in pandas?
Only when zero is the true value, such as a count of events that didn't occur. For measurements that weren't recorded, keep the value missing and add an indicator column, because filling with zero pulls averages toward zero and makes missing data look like real observations.
How do I fill missing values in only one column?
Assign the filled column back, for example df["region"] = df["region"].fillna("Unknown"), or pass a dictionary to fill several columns with different values: df = df.fillna({"region": "Unknown"}). Columns not named in the dictionary are left as they are. Avoid df["region"].fillna("Unknown", inplace=True): under pandas 3.0 Copy-on-Write it doesn't change df, and pandas emits a ChainedAssignmentError warning (Copy-on-Write user guide).
Is it better to drop or fill missing values?
Usually neither. Keep rows with missing optional values, fill categories with an explicit label, and send rows missing a required field to an exceptions table with a reason. Dropping removes evidence, and filling can invent it.
What replaced fillna(method="ffill") in pandas?
Use df.ffill() and df.bfill(). Since pandas 3.0, passing method= to fillna raises a TypeError. For grouped data, sort first and use df.groupby(key)[col].ffill() so values never cross from one group into another.
Related reading
- Imputing Missing Values: Mean, Median, Model or Nothing?
- How to Clean Data With pandas: A Step-by-Step Walkthrough
- Cleaning Sensor and IoT Readings: Gaps, Spikes and Unit Errors
Sources
- pandas development team,
DataFrame.fillnaAPI reference, retrieved 2026-11-05. - pandas development team,
DataFrame.ffillAPI reference, retrieved 2026-11-05. - pandas development team, Working with missing data (user guide), retrieved 2026-11-05.
- pandas development team,
pandas.read_csvAPI reference, retrieved 2026-11-05. - pandas development team, Copy-on-Write (user guide), retrieved 2026-11-05.