Cleaning Sensor and IoT Readings: Gaps, Spikes and Unit Errors
Clean sensor time series in DuckDB SQL and pandas: retransmitted readings, error codes, unit mix-ups, range and spike tests, flat lines and gaps, with QC flags.
By Tnas · Published · 11 min read
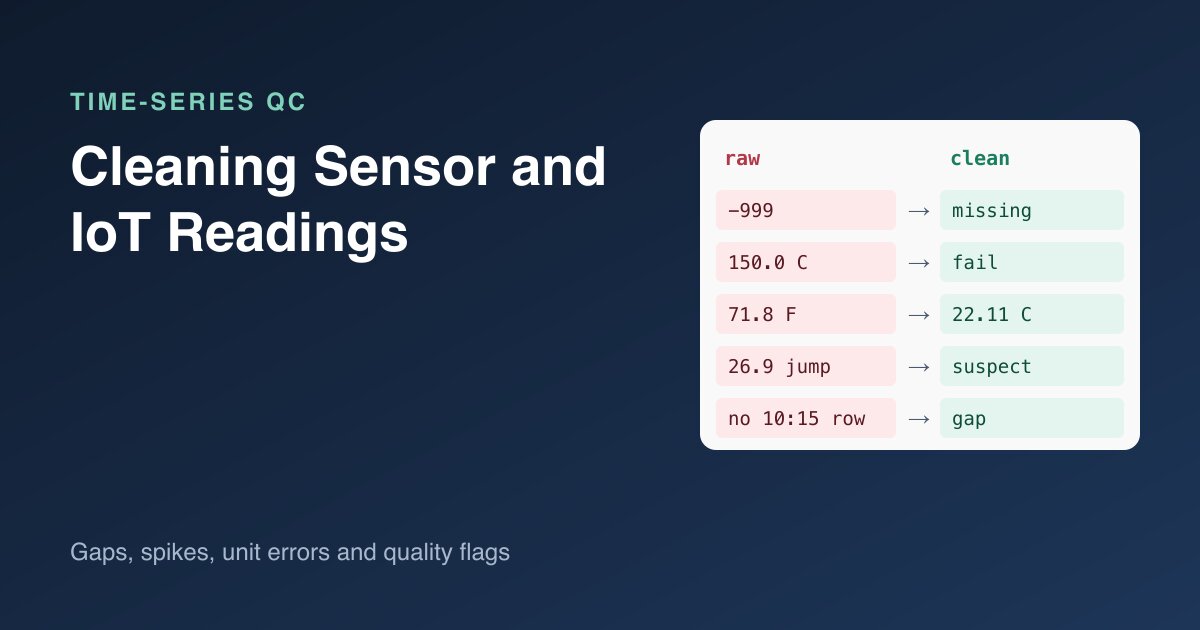
Sensor data fails in its own ways. Devices resend readings when a connection drops, report error codes as if they were measurements, switch units after a firmware update, freeze on one value, and go quiet for minutes at a time. The fix isn't to delete whatever looks odd. It's to give every reading a quality flag and a reason, so a chart can hide bad points while the raw record stays intact. A quality flag is a code stored beside each reading that says whether it passed its checks. This post cleans two temperature sensors in DuckDB SQL, then fills short gaps in pandas with an explicit imputed column.
Key Takeaways
- Remove exact retransmissions first, but check that repeated timestamps carry the same value before you drop anything.
- Treat device error codes such as
-999as missing values with a reason, never as measurements.- Convert units from the unit column, and flag readings whose value fits the other unit better than the one on the label.
- Flag, don't delete: impossible values fail, spikes and flat lines are suspect, and everything keeps its raw value.
- Find gaps by comparing readings with the expected sampling grid, and only fill short gaps, with an
imputedmarker.
A flagging scheme borrowed from ocean observing
Real-time ocean monitoring has a published answer to "how do we mark bad sensor data?". The US Integrated Ocean Observing System's QARTOD flag manual uses five primary flags: pass (1), not evaluated (2), suspect or of high interest (3), fail (4) and missing data (9). A record's primary flag is set to the worst result of its individual tests (US IOOS, Manual for Real-Time Oceanographic Data Quality Control Flags, version 1.2, 2020). The same idea works for a warehouse thermometer or a factory vibration sensor: the flag travels with the reading, and the data user decides what to exclude.
This post uses those labels in plain text, with the reason attached:
| Flag | Meaning here | Example |
|---|---|---|
pass |
Passed every test | 21.4 °C |
suspect |
Plausible but unusual; a person should look | A one-reading jump of 5 °C |
fail |
Can't be a valid reading | 150 °C indoors |
missing |
No usable value | Error code -999, or no reading at all |
The readings
Two indoor temperature sensors report every five minutes. The data is invented for this example, and its data dictionary says -999 means the sensor couldn't take a reading.
sensor_id,reading_at,value,unit
T1,2026-03-02T10:00:00Z,21.4,C
T1,2026-03-02T10:05:00Z,21.5,C
T1,2026-03-02T10:05:00Z,21.5,C
T1,2026-03-02T10:10:00Z,21.6,C
T1,2026-03-02T10:25:00Z,150.0,C
T1,2026-03-02T10:20:00Z,21.7,C
T1,2026-03-02T10:30:00Z,21.8,C
T1,2026-03-02T10:35:00Z,-999,C
T1,2026-03-02T10:40:00Z,21.9,C
T1,2026-03-02T10:45:00Z,26.9,C
T1,2026-03-02T10:50:00Z,22.0,C
T2,2026-03-02T10:00:00Z,22.0,C
T2,2026-03-02T10:05:00Z,71.8,F
T2,2026-03-02T10:10:00Z,71.9,C
T2,2026-03-02T10:15:00Z,22.2,C
T2,2026-03-02T10:20:00Z,22.2,C
T2,2026-03-02T10:25:00Z,22.2,C
T2,2026-03-02T10:30:00Z,22.2,C
T2,2026-03-02T10:35:00Z,22.2,C
T2,2026-03-02T10:40:00Z,22.2,C
Look closely and you can find a retransmitted row, two rows out of order, a missing 10:15 reading, an error code, an impossible value, a one-off jump, a reading in Fahrenheit, a Fahrenheit value labelled as Celsius, and a sensor that may have frozen at 22.2 °C. All code below was run with DuckDB 1.5.1 and pandas 3.0.2; DuckDB output tables are trimmed of their type rows to fit the page.
Step 1: Remove retransmissions, carefully
Devices on unreliable networks may resend a reading they aren't sure was received. An exact copy, same sensor, same timestamp and same value, is safe to collapse. Check first that no timestamp carries two different values, because that's a conflict, not a retransmission:
SET TimeZone = 'UTC';

CREATE TABLE raw AS
SELECT * FROM read_csv('readings.csv', all_varchar = true);

SELECT sensor_id, reading_at, count(DISTINCT value) AS values_seen
FROM raw
GROUP BY ALL
HAVING count(DISTINCT value) > 1;
That query returns no rows, so every repeat is an exact copy. Now type the columns and keep one row per reading:
CREATE TABLE typed AS
SELECT DISTINCT
       sensor_id,
       CAST(reading_at AS TIMESTAMPTZ) AS reading_at,
       CAST(value AS DOUBLE) AS value_raw,
       upper(trim(unit)) AS unit
FROM raw;

SELECT (SELECT count(*) FROM raw) AS rows_in, count(*) AS distinct_readings FROM typed;
┌─────────┬───────────────────┐
│ rows_in │ distinct_readings │
├─────────┼───────────────────┤
│      20 │                19 │
└─────────┴───────────────────┘
The Z suffix marks the timestamps as UTC, so casting to TIMESTAMPTZ keeps them as instants. Order in the file doesn't matter from here on: every later step sorts by reading_at. The exercise Keep the first delivery of each event practises the related case where copies arrive at different times.
Step 2: Turn error codes into missing values and convert units
Two decisions happen in one pass. The error code becomes NULL with a reason, and Fahrenheit readings are converted using the unit column:
CREATE TABLE celsius AS
SELECT *,
  CASE
    WHEN value_raw = -999 THEN NULL
    WHEN unit = 'F' THEN round((value_raw - 32) * 5 / 9, 2)
    WHEN unit = 'C' THEN value_raw
  END AS temp_c,
  CASE
    WHEN value_raw = -999 THEN 'sensor error code -999'
    WHEN unit NOT IN ('C', 'F') THEN 'unknown unit'
  END AS missing_reason
FROM typed;
Left as a number, -999 would drag any average far below zero. Converted to NULL, it drops out of averages and shows up in counts of missing readings instead. The lesson Sentinel values are missing values in disguise and the exercise Turn sentinel codes into missing values cover the pattern. A unit the code doesn't recognise also becomes missing, with its own reason, rather than being guessed.
Step 3: Run the quality tests
Four tests run in a fixed order, and each reading gets the first flag that applies:
- Missing: no usable value.
- Range (fail): outside −10 °C to 60 °C, a plausible indoor range chosen for this example. If an out-of-range "Celsius" value, read as Fahrenheit, lands within 3 °C of the previous valid reading (or the next one at the start of a series), the reason says so.
- Spike (suspect): more than 3 °C away from both the previous and the next valid reading.
- Flat line (suspect): the same value six or more times in a row, which is 30 minutes at this sampling rate.
The first and last readings of each sensor have only one neighbour, so the spike test can't flag them; review the ends of a series separately if they matter.
CREATE TABLE checked AS
WITH ranged AS (
  SELECT *,
    temp_c IS NOT NULL AND (temp_c < -10 OR temp_c > 60) AS out_of_range
  FROM celsius
),
neighbours AS (
  SELECT *,
    lag(CASE WHEN NOT out_of_range THEN temp_c END IGNORE NULLS)
      OVER (PARTITION BY sensor_id ORDER BY reading_at) AS prev_c,
    lead(CASE WHEN NOT out_of_range THEN temp_c END IGNORE NULLS)
      OVER (PARTITION BY sensor_id ORDER BY reading_at) AS next_c
  FROM ranged
),
runs AS (
  SELECT *,
    row_number() OVER (PARTITION BY sensor_id ORDER BY reading_at)
      - row_number() OVER (PARTITION BY sensor_id, temp_c ORDER BY reading_at) AS run_id
  FROM neighbours
)
SELECT sensor_id, reading_at, value_raw, unit, temp_c, missing_reason,
  CASE
    WHEN temp_c IS NULL THEN 'missing'
    WHEN out_of_range AND unit = 'C'
         AND (temp_c - 32) * 5 / 9 BETWEEN coalesce(prev_c, next_c) - 3 AND coalesce(prev_c, next_c) + 3
      THEN 'fail: possible Fahrenheit labelled C'
    WHEN out_of_range THEN 'fail: outside -10 to 60 C'
    WHEN abs(temp_c - prev_c) > 3 AND abs(temp_c - next_c) > 3 THEN 'suspect: spike'
    WHEN count(*) OVER (PARTITION BY sensor_id, temp_c, run_id) >= 6 THEN 'suspect: flat line'
    ELSE 'pass'
  END AS qc_flag
FROM runs;

SELECT sensor_id, reading_at, value_raw, unit, temp_c, qc_flag
FROM checked ORDER BY sensor_id, reading_at;
┌───────────┬──────────────────────────┬───────────┬─────────┬────────┬──────────────────────────────────────┐
│ sensor_id │        reading_at        │ value_raw │  unit   │ temp_c │               qc_flag                │
├───────────┼──────────────────────────┼───────────┼─────────┼────────┼──────────────────────────────────────┤
│ T1        │ 2026-03-02 10:00:00+00   │      21.4 │ C       │   21.4 │ pass                                 │
│ T1        │ 2026-03-02 10:05:00+00   │      21.5 │ C       │   21.5 │ pass                                 │
│ T1        │ 2026-03-02 10:10:00+00   │      21.6 │ C       │   21.6 │ pass                                 │
│ T1        │ 2026-03-02 10:20:00+00   │      21.7 │ C       │   21.7 │ pass                                 │
│ T1        │ 2026-03-02 10:25:00+00   │     150.0 │ C       │  150.0 │ fail: outside -10 to 60 C            │
│ T1        │ 2026-03-02 10:30:00+00   │      21.8 │ C       │   21.8 │ pass                                 │
│ T1        │ 2026-03-02 10:35:00+00   │    -999.0 │ C       │   NULL │ missing                              │
│ T1        │ 2026-03-02 10:40:00+00   │      21.9 │ C       │   21.9 │ pass                                 │
│ T1        │ 2026-03-02 10:45:00+00   │      26.9 │ C       │   26.9 │ suspect: spike                       │
│ T1        │ 2026-03-02 10:50:00+00   │      22.0 │ C       │   22.0 │ pass                                 │
│ T2        │ 2026-03-02 10:00:00+00   │      22.0 │ C       │   22.0 │ pass                                 │
│ T2        │ 2026-03-02 10:05:00+00   │      71.8 │ F       │  22.11 │ pass                                 │
│ T2        │ 2026-03-02 10:10:00+00   │      71.9 │ C       │   71.9 │ fail: possible Fahrenheit labelled C │
│ T2        │ 2026-03-02 10:15:00+00   │      22.2 │ C       │   22.2 │ suspect: flat line                   │
│ T2        │ 2026-03-02 10:20:00+00   │      22.2 │ C       │   22.2 │ suspect: flat line                   │
│ T2        │ 2026-03-02 10:25:00+00   │      22.2 │ C       │   22.2 │ suspect: flat line                   │
│ T2        │ 2026-03-02 10:30:00+00   │      22.2 │ C       │   22.2 │ suspect: flat line                   │
│ T2        │ 2026-03-02 10:35:00+00   │      22.2 │ C       │   22.2 │ suspect: flat line                   │
│ T2        │ 2026-03-02 10:40:00+00   │      22.2 │ C       │   22.2 │ suspect: flat line                   │
└───────────┴──────────────────────────┴───────────┴─────────┴────────┴──────────────────────────────────────┘
What each flag tells you
- 150.0 °C fails the range test. No indoor room reaches that, so it isn't an outlier to debate; it's a fault.
- 71.9 "C" fails, with a more useful reason. As Fahrenheit it would be 22.2 °C, right beside its neighbours, so the label is probably wrong. The pipeline doesn't convert it automatically, because a guess about units is still a guess. Someone who knows the device's firmware history can confirm and add a rule.
- 71.8 F passes after conversion to 22.11 °C. The unit column did its job.
- 26.9 °C is suspect, not deleted. A door opening or sunlight on the sensor could cause a real five-minute jump. The flag asks a person to look.
- The six readings of 22.2 °C are suspect. A stable room can hold one temperature to a tenth of a degree for half an hour. A frozen sensor looks identical. The flag records the doubt without deciding.
How the SQL finds neighbours and runs
Two details in the SQL matter. IGNORE NULLS makes lag and lead skip missing and out-of-range readings when they look for neighbours, so the error code and the 150 °C fault don't make the reading next to them look like a spike (DuckDB, window functions). The two row_number() calls subtract to the same run_id for consecutive identical values, a gaps-and-islands technique that lets count(*) measure each run. The exercise Impossible versus unusual readings and the guide Outliers: flag, don't delete practise the fail-versus-suspect distinction.
Step 4: Find gaps against the expected grid
A missing reading doesn't appear as a row, so you can't find it by looking at rows. Build the grid of timestamps each sensor should have produced and anti-join the readings against it (DuckDB, list functions including generate_series):
WITH bounds AS (
  SELECT sensor_id, min(reading_at) AS first_at, max(reading_at) AS last_at
  FROM checked GROUP BY sensor_id
),
expected AS (
  SELECT sensor_id,
         unnest(generate_series(first_at, last_at, INTERVAL 5 MINUTE)) AS reading_at
  FROM bounds
)
SELECT e.sensor_id, e.reading_at AS missing_slot
FROM expected e
ANTI JOIN checked c USING (sensor_id, reading_at)
ORDER BY e.sensor_id, e.reading_at;
┌───────────┬──────────────────────────┐
│ sensor_id │       missing_slot       │
├───────────┼──────────────────────────┤
│ T1        │ 2026-03-02 10:15:00+00   │
└───────────┴──────────────────────────┘
T1 skipped 10:15. That's different from the 10:35 error code: there, the device was online and said it couldn't read; at 10:15, nothing arrived at all. Both are "missing" in the QARTOD sense, but the reasons point at different fixes, a sensor fault versus a network or power problem. This grid only spans each sensor's first to last reading; to catch a sensor that stopped reporting entirely, build the grid up to the current time instead.
Before the next step, export the flagged readings for pandas:
COPY (SELECT sensor_id, reading_at, temp_c, qc_flag FROM checked ORDER BY sensor_id, reading_at)
  TO 'checked.csv' (HEADER);
Step 5: Fill short gaps only, and say so
For a chart or a model that needs regular intervals, filling a single missing slot by interpolating between its neighbours is usually reasonable. Filling half an hour isn't. In pandas, keep only readings that passed, put them on the five-minute grid, and fill only gaps one slot long:
import pandas as pd

checked = pd.read_csv("checked.csv", parse_dates=["reading_at"])
t1 = checked[(checked["sensor_id"] == "T1") & (checked["qc_flag"] == "pass")]
t1 = t1.set_index("reading_at")["temp_c"]

grid = t1.asfreq("5min")                      # absent slots appear as NaN
gap = grid.isna()
run = (gap != gap.shift()).cumsum()
gap_len = gap.groupby(run).transform("size")
fillable = gap & (gap_len == 1)              # only single-slot gaps

filled = grid.interpolate(method="time").where(~gap | fillable)
out = pd.DataFrame({"temp_c": filled.round(2), "imputed": fillable})
print(out)
                           temp_c  imputed
reading_at
2026-03-02 10:00:00+00:00   21.40    False
2026-03-02 10:05:00+00:00   21.50    False
2026-03-02 10:10:00+00:00   21.60    False
2026-03-02 10:15:00+00:00   21.65     True
2026-03-02 10:20:00+00:00   21.70    False
2026-03-02 10:25:00+00:00   21.75     True
2026-03-02 10:30:00+00:00   21.80    False
2026-03-02 10:35:00+00:00   21.85     True
2026-03-02 10:40:00+00:00   21.90    False
2026-03-02 10:45:00+00:00   21.95     True
2026-03-02 10:50:00+00:00   22.00    False
Each filled value carries imputed = True, so anyone computing a maximum or an alert threshold can leave them out. The run-length mask matters: interpolate(limit=1) on its own would still fill the first slot of a two-slot gap, which isn't what "fill single gaps" means (pandas, DataFrame.interpolate). Note also that the suspect 26.9 °C reading at 10:45 is replaced in this chart view only; the raw value and its flag are still in checked. The exercise Impute with an indicator column practises the indicator pattern.
What to hand over
A cleaned sensor table should let anyone answer "what did the device say, and do we trust it?" for every timestamp:
| Column | Purpose |
|---|---|
sensor_id, reading_at |
One row per sensor per instant, in UTC |
value_raw, unit |
Exactly what the device sent |
temp_c |
Converted value, NULL when there's no usable reading |
qc_flag |
pass, suspect: …, fail: … or missing |
missing_reason |
Why a value is missing, when it is |
imputed |
In derived views only, true where a value was filled |
Add a short summary per sensor, counts of pass, suspect, fail and missing readings plus gap slots, and the people running the devices will see which sensors need attention before anyone builds a dashboard on them.
Related reading
- How to Detect Outliers: IQR, Z-Scores and Domain Rules Compared
- Handling Late-Arriving and Updated Records in a Cleaning Pipeline
- Cleaning Timesheet and Payroll Data: Hours, Shifts and Overtime